
ZigZagBid – User Guide for Traders
Turn complex markets into clear trading scenarios.
1. What ZigZagBid Is (and Why Traders Use It)
ZigZagBid is a trade-oriented analytical system that merges classical reversal techniques with state-of-the-art machine learning, statistics, and LLM (large language model) technology to help you stack probabilities in your favor.
Instead of juggling dozens of charts, indicators, and opinions, ZigZagBid gives you two powerful core workspaces plus a dedicated AI swing forecast tab:
- Current View – fast, structured forecasts for the next trading sessions.
- Swing – AI-generated low/high projections for the next 1 bar and the next 12 bars.
- Chart View – a visual “decision cockpit” where all predictions are combined into one clear picture.
Think of it as having several disciplined, data-driven analysts on your desk, all summarizing what they see so you can decide faster and with more confidence.
2. Getting Started: Your First 3 Minutes
-
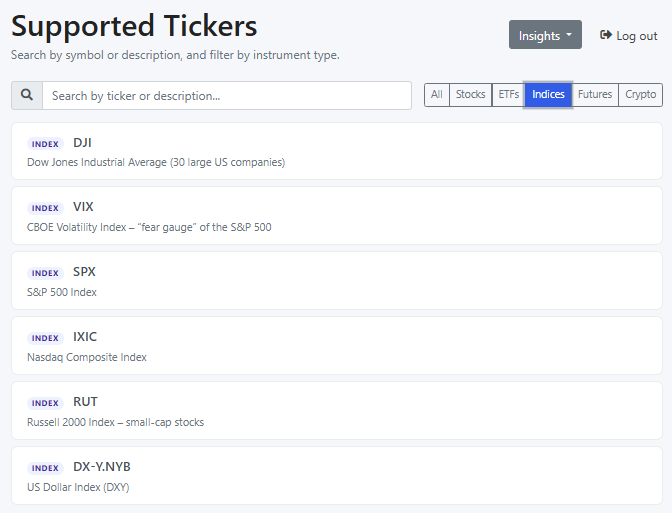
Log in and choose a ticker.
After login you’ll see the Supported Tickers page. Use the search box and type filters (Stocks, ETFs, Indices, Crypto, etc.) to find the instrument you want to analyze. Then click on the ticker row. -
Review the Current View.
Once you click a ticker, ZigZagBid opens the Current View tab for that instrument. You’ll immediately see short-term and medium-term models, plus reversal levels. -
Open the Swing tab.
Switch to Swing to review the AI Swing-Engine forecast. It estimates the likely low and high values for the next 1 bar (intraday) and for the next 12 bars. -
Switch to Chart View.
From there, switch to the Chart View tab. You’ll see projected prices as colored dots, support/resistance bands, and probability bars that tell you how strong a potential move might be.
Take 30 seconds to ask yourself:
“If I had to plan the next 12 trading sessions right now, what would I do with this information?”
That simple habit turns ZigZagBid from “interesting tool” into an everyday trading companion you’ll want access to before each session.
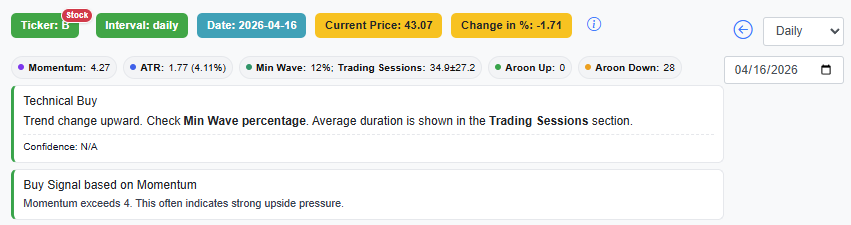
3. Signals
Different signals can appear in the upper section of the selected ticker. These signals summarize possible market behavior and help you quickly understand what kind of move may be developing.
- Oversold: Expect a +1x ATR pullback over the next 12 trading sessions (bars).
- Overbought: Expect a -1x ATR pullback over the next 12 trading sessions (bars).
- Reaction Up: Expect a +2x ATR pullback over the next 15 trading sessions (bars).
- Reaction Down: Expect a -2x ATR pullback over the next 15 trading sessions (bars).
- Slingshot: Possible sharp bullish move of +4x ATR within 5 trading sessions (bars).
- Waterfall: Possible sharp bearish move of -4x ATR within 5 trading sessions (bars).
- Rally Ahead: Slow and stable bullish move of +3x ATR over 30 trading sessions (bars).
- Bearishness Ahead: Slow and stable bearish move of -3x ATR over 30 trading sessions (bars).
- Knee Jerk Low: Pullback during a rally; a new higher high is expected within 30 trading sessions (bars).
- Knee Jerk High: Pullback during bearishness; a new lower low is expected within 30 trading sessions (bars).
- Technical Buy: Trend change upward. Check Min Wave percentage. Average duration is shown in the Trading Sessions section.
- Technical Sell: Trend change downward. Check Min Wave percentage. Average duration is shown in the Trading Sessions section.
4. The Current View Tab – Your Daily Trading Radar
The Current View is where you check what may happen next in the market.
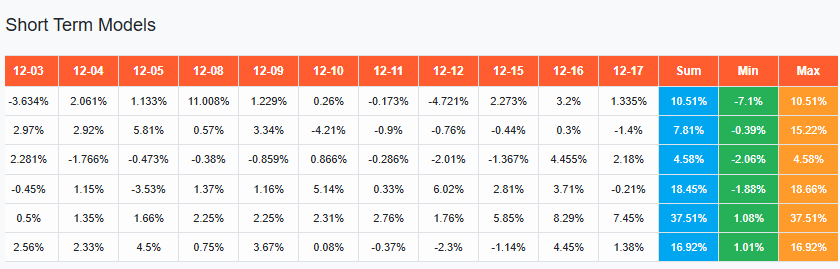
4.1 Short-Term Models – Next 12 Sessions at a Glance
These are time-series models forecasting the next 12 trading sessions, with options for weekly and monthly views as well.
For each model, you’ll see:
- Day-by-day forecast
- Summary for the range
- Predicted Min and Max points
How to use it mentally:
Look across the models and notice where they agree. When different models point in the same direction, it’s a signal worth your attention—even if you ultimately choose not to trade it.
This kind of structured “model consensus” is hard to replicate on your own, and it’s exactly the kind of edge traders pay for: a way to quickly separate noise from recurring patterns.
Subscriber habit: Many subscribers open Current View first thing in the morning, scan the 12-session forecast in under a minute, and then dig deeper only into the assets where several models point the same way.
4.2 Medium-Term Models – Catching the Bigger Reversals
ZigZagBid includes three medium-term models:
- XDFTP
- XDPCOMBI
- VSDPCOMBI
These models are built on dozens of parameters and aim to forecast:
- Where a trend is likely to reverse (min/max turning points)
- When that reversal is expected to happen (in trading sessions)
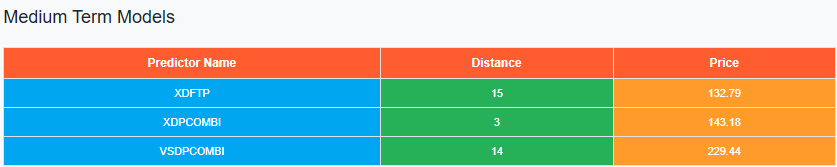
You’ll see a Distance value:
- Positive distance → price isn’t at the turning point yet.
- Negative distance → the model suggests a trend change has likely started, but isn’t fully confirmed.
How this helps you:
You don’t just see “up” or “down”; you see where and roughly when the bigger shift might occur.
That’s the kind of information that can shape your swing and position trades instead of reacting
candle by candle.
4.3 Cycle Turning Points – A Simple “When” for the Next High/Low
Cycle Turning Points answers a very practical question: “How many bars until the next likely cycle High or Low?”
It does not try to guess a specific price. It’s primarily a timing tool: a “distance-to-turn” estimate in bars (trading sessions), for both a smaller swing (Minor) and a bigger swing (Major).
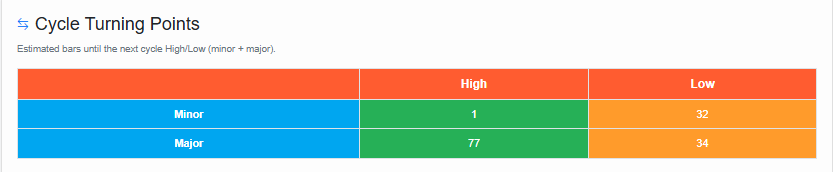
How to read it:
- Minor High / Minor Low → nearer-term swing timing (smaller turn).
- Major High / Major Low → broader swing timing (bigger turn). Sometimes it can be unavailable (N/A).
Why traders care:
Many losses come from being “right” on direction but entering at the wrong moment. Cycle Turning Points helps you avoid accidental bad timing—like adding risk right before a swing high, or cutting risk right before a swing low.
Manager translation: trend is the strategy direction, cycle turning points help execution timing.
4.4 Swing Tab – AI Swing-Engine Forecasts
Swing suggestions are no longer shown inside Current View. They now live in their own dedicated Swing tab, where the AI Swing-Engine focuses on a very practical question: what is the likely price range ahead?
- It estimates the likely low and high for the next 1 bar (intraday).
- It also estimates the likely low and high for the next 12 bars.
- The goal is to give you a compact AI-based range forecast you can compare with your own market view.
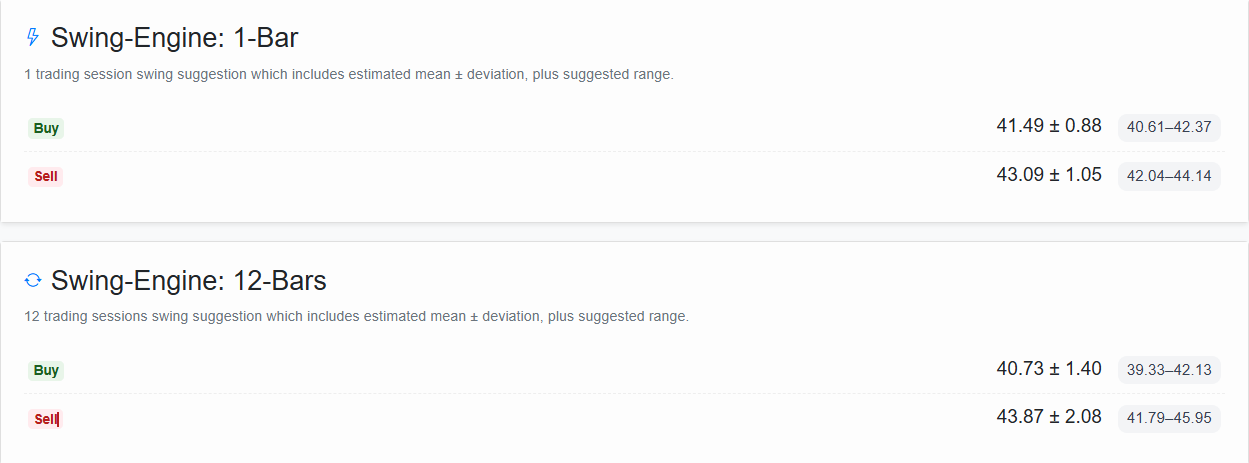
In the Swing tab you can quickly read:
- The projected intraday low/high zone for the next bar
- The projected broader low/high zone for the next 12 bars
- A clean AI summary of where price may stretch in the short term and near term
Pro mindset to adopt:
Don’t treat it as a promise. Treat it as an informed scenario. If the Swing-Engine range lines up with your own setup, it can strengthen conviction. If it sharply disagrees, that’s often a reason to slow down and re-check your assumptions before taking risk.
4.5 Active Reversal Levels – Daily, Weekly, Monthly
Within Current View you’ll also find active reversal levels across different timeframes:
- Daily
- Weekly
- Monthly
These act as dynamic support/resistance zones where historical behavior suggests the price often changes direction.
Practical tip:
When a forecasted move lines up with an active reversal level, it’s a natural place to pause and ask:
“If the market respects this level again, how do I want to position myself?”
Subscribers who consistently check reversal levels often start to feel that they’re “seeing” the market’s structure more clearly than before—which is exactly the feeling you want before committing real capital.
4.6 Early-Stage AI Trade Ideas (Alpha)
ZigZagBid also includes AI-generated trade ideas in an early (alpha) stage.
These can:
- Spark new perspectives you might not have considered.
- Serve as starting points for your own research and strategy.
Why this matters:
Idea generation is one of the most time-consuming parts of trading. Having a machine constantly propose structured ideas helps you focus your time on validation and execution—not endless scanning.
5. The Chart View Tab – Your Visual Decision Center
If Current View is your radar, Chart View is your cockpit.
Here, ZigZagBid combines all predictions into one clear, visual layout to support your final decision.
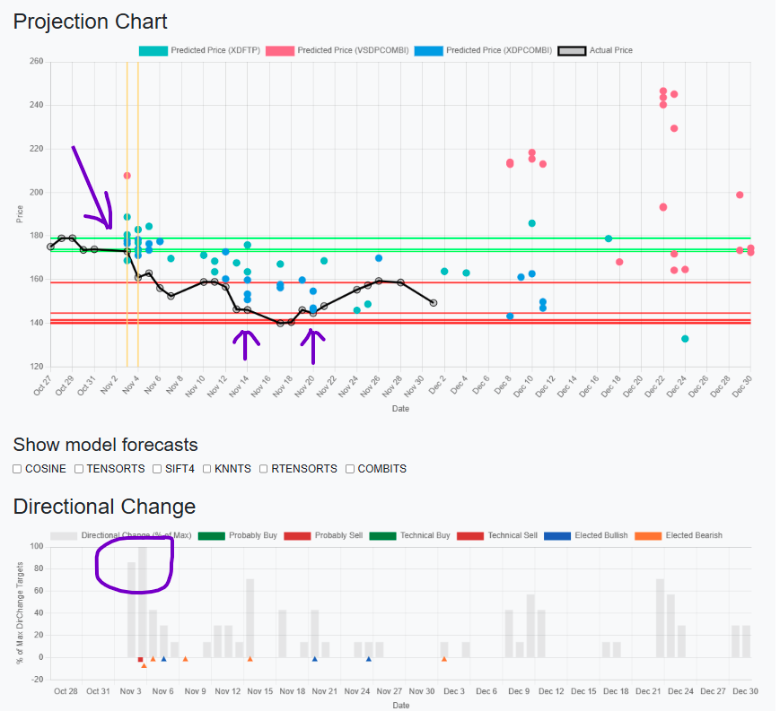
On the projection chart you’ll find:
- Projected Prices (Dots)
Each dot represents a predicted future price level at a specific date. - Directional Change Bars
Below the chart, bars display the statistical probability and often the depth of the expected price change—higher bars mean stronger statistical conviction. - Support & Resistance Reversal Lines
Red lines – potential support zones
Green lines – potential resistance zones - Model Checkboxes
You can toggle different time-series models on and off to see how each one projects the future.
5.1 Cyclical Analysis – Timing the Wave, Not Just the River (NEW)
Cyclical Analysis is designed to prevent a classic trading mistake: being right on direction, but wrong on timing.
Here’s the core idea in plain language:
- Trend tells you which way the river is flowing.
- Oscillator tells you where you are within the waves on that river.
If you only look at the river current (trend), you can still buy at wave crests and sell at wave troughs by accident. The oscillator helps you see whether you’re closer to a “crest” (higher pullback risk) or a “trough” (higher bounce risk).
Manager translation: Trend = strategy direction. Oscillator = execution timing.
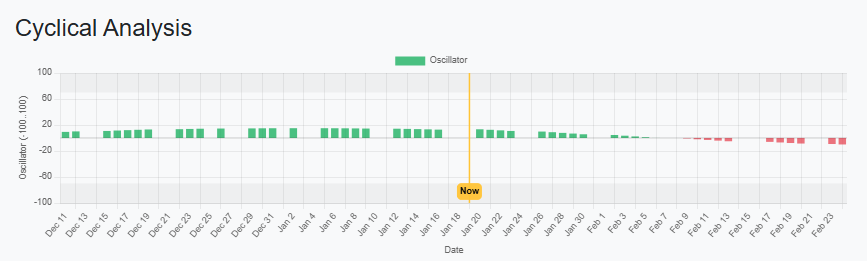
How to read the chart:
- Bar height = oscillator strength (range −100 to +100).
- Green bars (positive) suggest the cycle is in the “upper” part of its swing (more crest-like).
- Red bars (negative) suggest the cycle is in the “lower” part of its swing (more trough-like).
- Yellow “Now” line shows today’s position inside the history + forward window.
- Tooltip details include:
- Confidence (how reliable the signal is in this region),
- Minor and Major turning point distances (bars to High / bars to Low),
- Major values may be N/A if not available.
Why this is useful (without pretending it “predicts the price”):
The oscillator is more like risk control than price prediction. It’s not claiming “the price will be X.” It’s saying: the probability of a near-term reversal is higher/lower because we’re closer to the cycle’s extremes.
That’s extremely useful for:
- position sizing decisions
- hedging timing
- tightening stops
- knowing when to add vs when to wait
“Trend is where the market is going; oscillator is where we are within the swing on the way there. It’s powerful because most trading mistakes come from bad timing—adding risk near crests and cutting risk near troughs—even when the trend call is right.”
5.2 A Common Use Pattern
A commonly taught rule of thumb in the system is:
-
Consider buying when:
- The current price meets a predicted dot,
- That dot is close to a support (red) reversal level, and
- The directional change bar for that date is relatively high.
-
Consider selling / reducing exposure when:
- The current price meets a predicted dot near a resistance (green) reversal,
- Again, with a relatively high directional change bar.
Important: These are analytical guidelines built into ZigZagBid’s logic—not guaranteed outcomes. They are designed to focus your attention on key areas where probability and structure may align.
When you see the chart in action, it becomes much easier to imagine scenarios like:
“If price dips into this support zone where multiple models see a bounce, how do I want to react?”
That kind of pre-planning is what many traders are actually paying for: fewer surprises and more structured decision making.
6. A Simple Workflow You Can Repeat Every Session
Here is a repeatable flow that many traders find effective:
-
Scan Short-Term Models (1–2 minutes)
Look for clusters where multiple models suggest a similar direction over the next 12 sessions. -
Check Medium-Term Models (1 minute)
Note any upcoming turning points (distances approaching or crossing zero). -
Review the Swing tab (1 minute)
Compare the AI Swing-Engine’s 1-bar and 12-bar low/high forecasts to your own market view. -
Confirm in Chart View (3–5 minutes)
See where projected dots, reversal lines, and probability bars align. Use checkboxes to compare different models visually. -
Document Your Plan
Before trading, write a short “if–then” plan, for example:- If price reaches X near support with strong probability bar, I’ll consider entering with size Y.
- If price hits resistance with high probability bar, I’ll consider taking profits or tightening risk.
Using this workflow consistently gives you a structured, subscription-worthy routine that can be reused in any market environment.
7. Why Keep a Subscription Active?
ZigZagBid is not about one “killer signal.” It’s about giving you a complete analytical environment that:
- Lets you see 12 sessions ahead instead of only reacting to the last candle.
- Highlights medium-term turns before they become obvious.
- Provides AI-driven scenarios through the Swing tab and alpha trade ideas that you can compare with your own analysis.
- Visualizes everything in Chart View, so potential setups stand out at a glance.
The true value appears over time:
- You develop consistent habits (daily scans, pre-planned reactions).
- You become more aware of where the probabilities may be shifting.
- You reduce the feeling of “I missed that move because I didn’t have a clear plan.”
If markets are part of your everyday life, it makes sense to keep the tool that structures your decisions available every day as well—that’s what your subscription is really buying.
8. Risk & Responsibility
It’s crucial to understand what ZigZagBid is not:
- It is not trading advice.
- It is not investment advice.
- All outputs are reports produced by AI and statistical models.
Always:
- Do your own research.
- Manage position sizing and risk according to your personal situation.
- Accept that no model, no matter how advanced, can eliminate risk.
ZigZagBid’s role is to give you a clearer map. Where you choose to walk on that map is your decision.
9. Next Step
If you find value in:
- Seeing structured forecasts instead of scattered indicators,
- Having AI-driven scenarios you can challenge or confirm,
- And using a visual dashboard to make more deliberate trading decisions,
then the logical next step is to activate or upgrade your ZigZagBid subscription and make this workflow part of your regular trading routine.
The markets will keep moving—with or without a plan. ZigZagBid is built to help you face each session with one.